Introduction
Understanding the average dental claim denial rates 2026 is critical for any practice looking to stabilize their revenue cycle in the first quarter of the year. Dental practices across the U.S. have faced a shifting landscape in insurance reimbursements. While technology has streamlined some aspects of the revenue cycle, denial rates are hitting new highs in specific pockets of the country. At Steadfast Billing Solutions, we’ve analyzed the emerging data to help offices understand where they stand compared to regional averages.
Table of Contents
The National Landscape: Average Dental Claim Denial Rates 2026 Trends
Nationally, the average dental claim denial rate has crept up to 10 -15%. The primary culprits? Stricter documentation requirements for “medical necessity” and the increasing use of AI-driven claim auditing by major carriers.
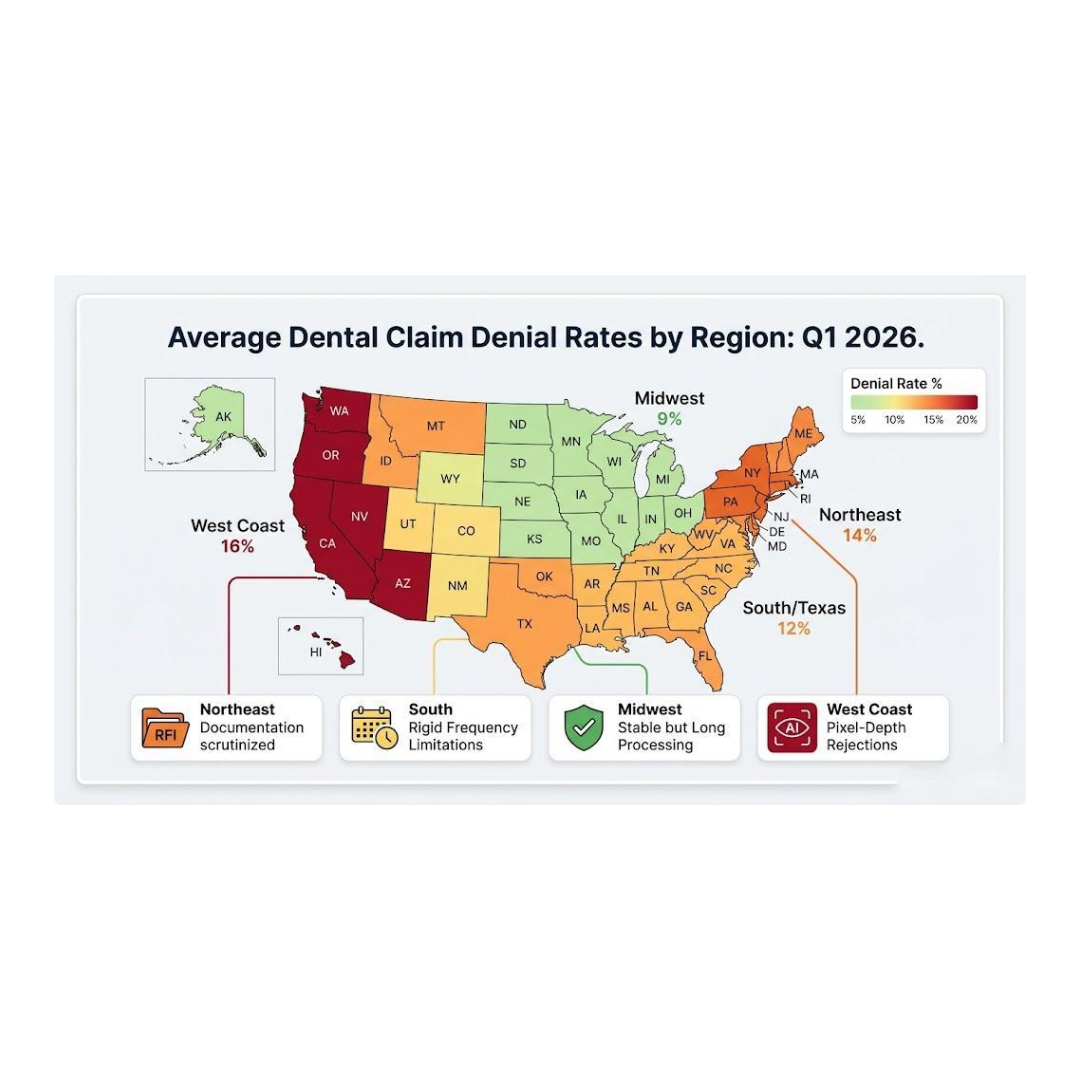
Regional Breakdown: Where is Your Practice?
| Region | Avg. Denial Rate (Q1 2026) | Primary Challenge |
| Northeast | 14% | High volume of “Incomplete Information” requests. |
| South/Texas | 12% | Frequent denials for “Frequency Limitations” on diagnostic codes. |
| Midwest | 9% | Highest clean-claim rate, but longer processing times. |
| West Coast | 16% | Strictest narrative requirements for restorative procedures. |
1. The Northeast: The Documentation Trap
Practices in states like New York and Pennsylvania are seeing a surge in ‘Request for Additional Information’ (RFI) notices that can delay payment by 30 to 60 days. In 2026, Northeast carriers are specifically scrutinizing periodontal charting and intraoral photos for Scaling and Root Planing (SRP) with a focus on ‘active’ disease markers.
To avoid these documentation traps, your clinical team must provide more than just a probe chart. We recommend including a clear narrative that mentions bleeding on probing (BOP) and specific localized bone loss. In this region, ‘silent’ claims—those sent without a narrative—are being automatically flagged for manual review, which is a primary driver of the higher average dental claim denial rates 2026 we are seeing in the Tri-State area.
2. The South & Texas: The Frequency Hurdle
In our home region, we’ve noted that payers are becoming more rigid with time-based limitations. If a prophy is performed even one day before the 6-month limit, the automated systems in the South are flagging it for immediate denial.
Offices in the South should implement a ‘one-day buffer’ rule, scheduling hygiene appointments 6 months and 2 days apart to bypass automated frequency rejections.
3. The West Coast: The “Medical Necessity” Fight
California and Washington practices are facing the highest denial rates in the country for 2026. This is largely due to new carrier “Artificial Intelligence” filters that reject crowns and buildups if the visible decay on a radiograph doesn’t meet a specific pixel-depth threshold.
With the rise of AI-driven claim auditing in 2026, insurance carriers are no longer just looking for the right codes—they are analyzing the ‘pixel-depth’ of your attached radiographs. To combat this, your clinical team must ensure that every x-ray is high-resolution and that the narrative explicitly mentions the decay depth that may be visible to a human eye but flagged by a machine algorithm.
How to Beat the 2026 Denial Trends
Knowing the data is only half the battle. To keep your practice’s collection ratio above 97%, you must adapt:
- Narrative Precision: Don’t just list the procedure; tell the story of the tooth.
- Pre-Authorizations: For the West Coast and Northeast, pre-auths are no longer optional—they are essential for cash flow.
- Expert Oversight: Sometimes, the best way to lower your denial rate is to have a dedicated team that knows these regional quirks.
Conclusion
Monitoring the average dental claim denial rates 2026 is the best way to ensure your practice doesn’t fall behind the national curve.
Whether you are in a high-denial zone or a more stable market, the goal remains the same: getting paid for the work you do. If your practice’s denial rate is higher than your regional average, it’s time to audit your front-office workflow.
Frequently Asked Questions (FAQ)
What is the average dental claim denial rate in 2026?
Nationally, the average dental claim denial rates 2026 hover between 10% and 15%. However, this varies significantly by region, with West Coast practices seeing peaks of 16% due to new AI-driven pixel-depth auditing.
How can I reduce my dental A/R days?
To reduce A/R days, we recommend a “Clean Claim First” approach. This includes verifying insurance 48 hours before the appointment and ensuring all narratives for restorative procedures are submitted with the initial claim rather than waiting for an RFI.
Is dental medical cross-billing worth it in 2026?
Yes. As traditional dental reimbursements tighten, dental medical cross-billing for procedures like sleep apnea appliances and bone grafts (D7953) is becoming a vital secondary revenue stream for modern practices.
Why are my bone graft claims (D7953) being denied?
Most D7953 bone graft denials in 2026 stem from a lack of “site-specific” documentation. Ensure your clinical notes clearly distinguish between a ridge preservation (D7953) and a sinus augment (D7950) to meet the new carrier-specific criteria.
Leave a Reply